Find Bullish
Crypto Breakouts
Before The Market Notices
Breakout Radar automatically scans the top 1,000 cryptocurrencies every day using technical analysis, price action, volume trends, momentum indicators, and breakout pattern detection — helping traders discover coins showing bullish strength and early breakout signals.
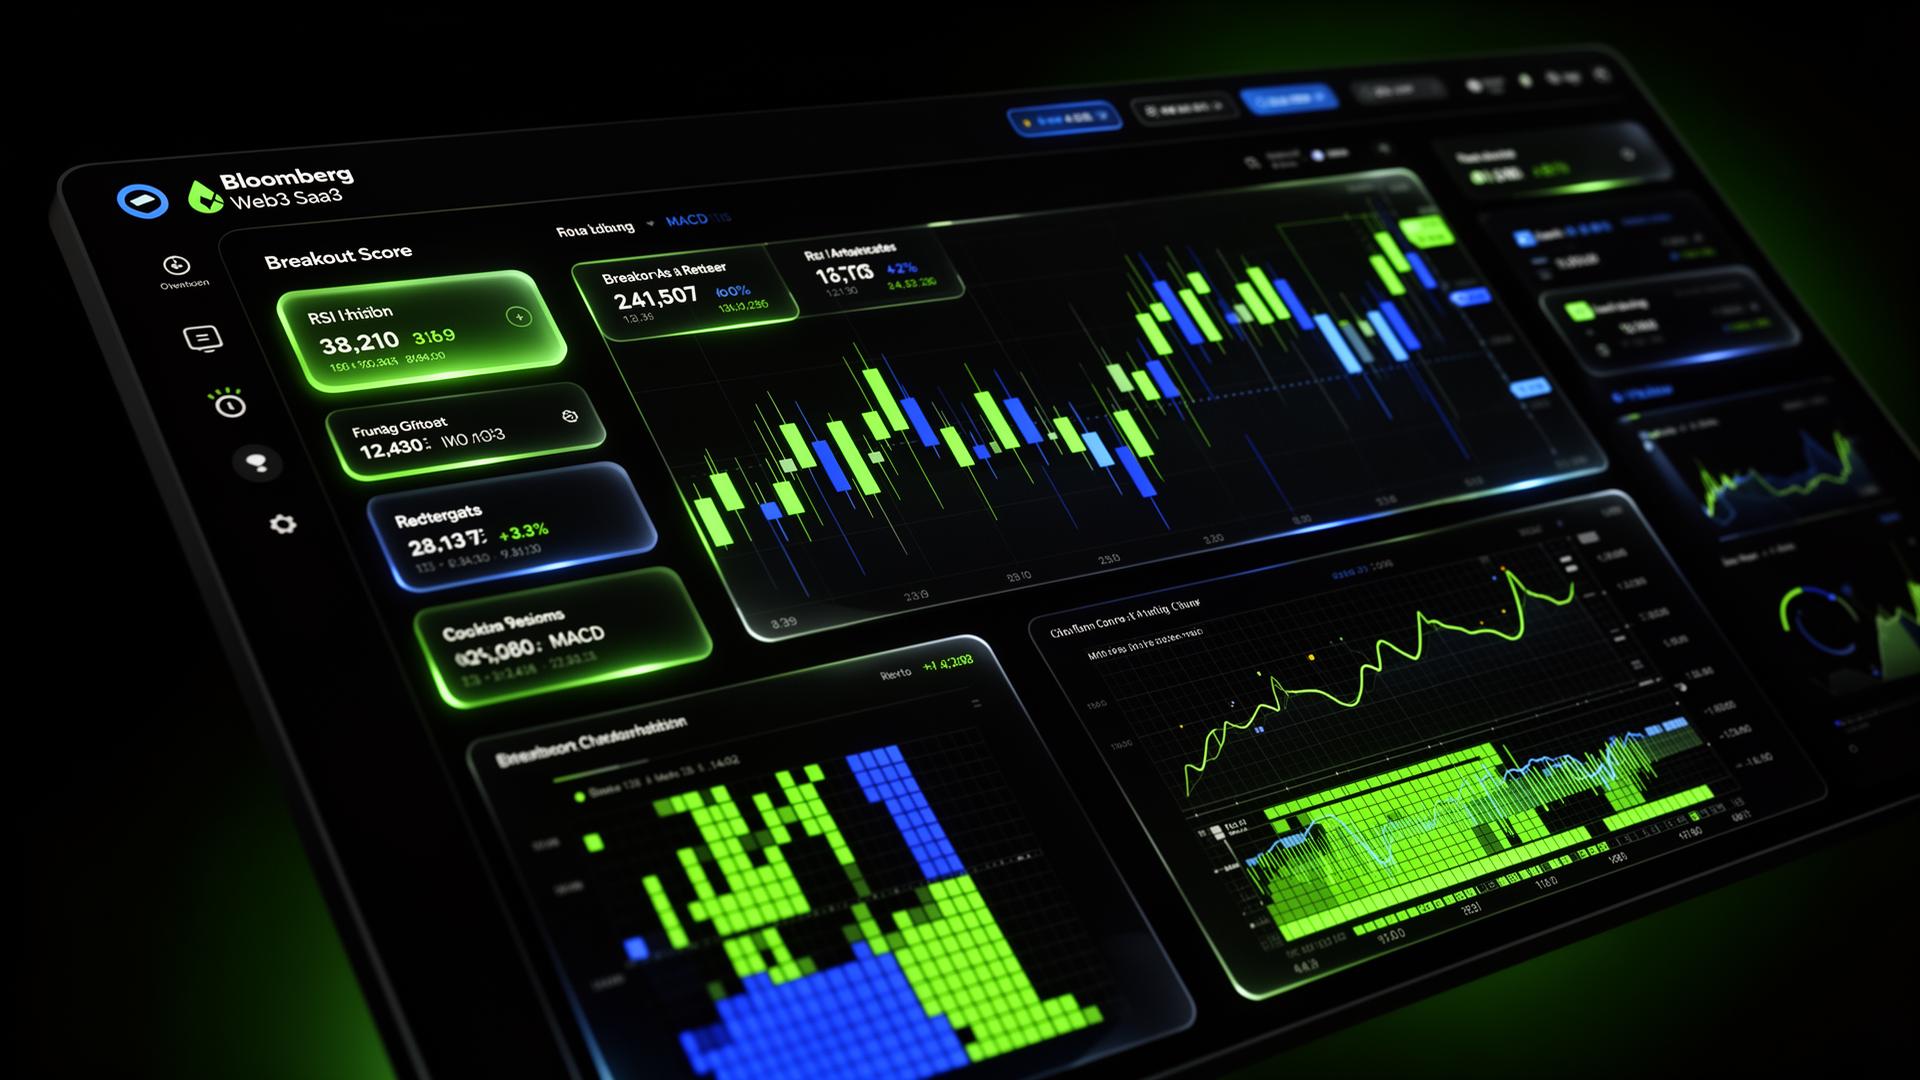
Every day, thousands of crypto charts move — but only a few show strong bullish setups. Breakout Radar analyzes the top 1,000 cryptocurrencies and ranks them by technical strength, breakout potential, volume confirmation, and trend momentum.
Everything you need to spot breakouts early
A complete technical analysis engine purpose-built for the crypto market — scanning, scoring, and surfacing the strongest setups every single day.
Daily Top 1,000 Scanner
Automatically analyze the largest cryptocurrencies by market cap every day using fresh data from CoinMarketCap and CoinGecko.
Bullish Pattern Detection
Detect ascending triangles, falling wedges, cup & handle, flags, higher highs/lows, and trendline breakouts.
Breakout Score Ranking
Every coin receives a simple 1–100 score based on price action, momentum, volume, trend strength, and structure.
Technical Indicator Engine
RSI, MACD, moving averages, Bollinger Bands, volatility, volume, and relative strength — all in one view.
Volume Surge Alerts
Surface coins where trading volume is expanding fast, suggesting stronger breakout confirmation.
Watchlist Builder
Save bullish coins to a personal watchlist and track how each setup develops day by day.
Market Heatmap
Visualize bullish, neutral, and bearish coins across the top 1,000 in a single, scannable grid.
AI Technical Summaries
Plain-English explanations of why a coin looks bullish, neutral, or bearish — written by an AI tuned for TA.
Risk Rating
Low, Medium, High, or Extreme — based on liquidity, volatility, trend quality, and volume confirmation.
Daily Email Reports
Wake up to the strongest bullish setups in your inbox. Skip the noise. See the signal.
Four steps from raw data to alpha
A repeatable, transparent process that runs every day — so you can focus on decisions, not data wrangling.
Pull Market Data
Collect daily price, volume, market cap, and historical OHLCV chart data for the top 1,000 cryptocurrencies.
Run Technical Analysis
Analyze each coin with indicators, chart structures, trend strength, momentum, and volume behavior.
Rank Breakout Candidates
Score and rank coins by bullish strength, breakout probability, volume confirmation, and setup quality.
Discover Opportunities
Review top-ranked bullish coins, save them to watchlists, and monitor price action over time.
Your command center for the crypto market
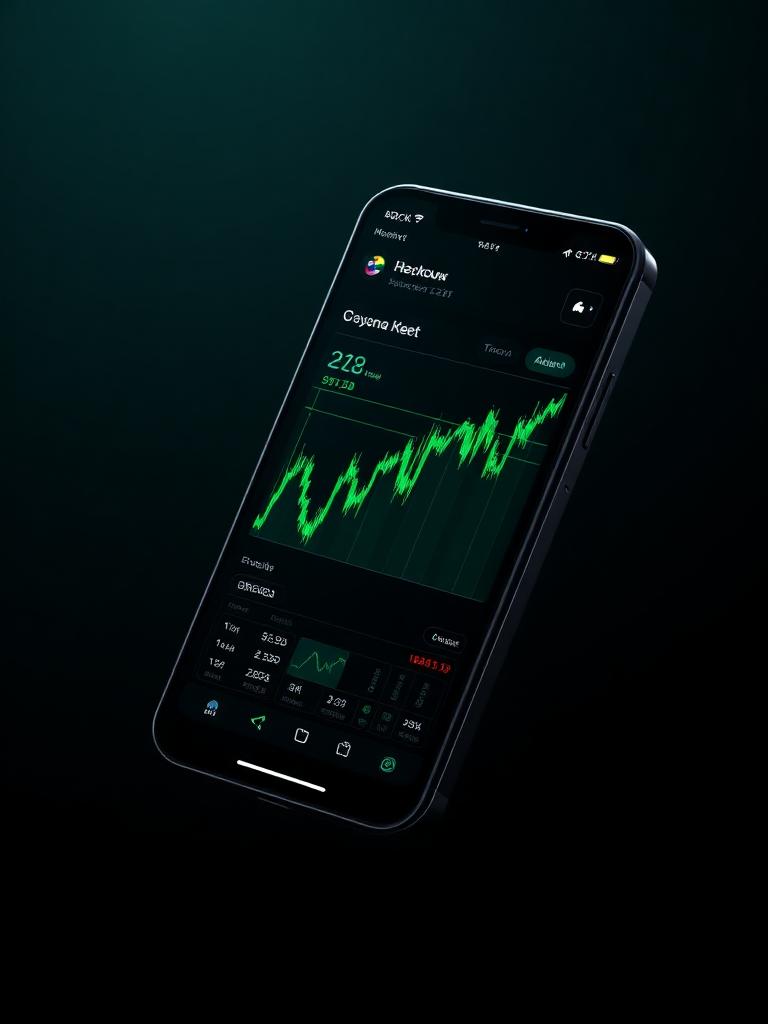
Today's top bullish coins, breakout scores, volume surges, momentum leaders, watchlists, and AI summaries — in one calm, scannable interface.
A full technical workup for every coin
Price and candlestick charts, support and resistance, breakout zones, indicator readings, moving average trends, bullish thesis, bearish invalidation, and a risk score — all on a single page.
"SOL is showing bullish momentum after breaking above short-term resistance with rising volume. RSI remains strong but not overextended, while the 20-day moving average is trending above the 50-day moving average. A confirmed close above the next resistance zone could signal continuation."
Built for traders who value their time
The market never sleeps. Your scanner shouldn't either. Let Breakout Radar do the heavy lifting so you can focus on decisions.
Made for the people who live on charts
Simple plans for serious traders
Start free. Upgrade when you want the full top-1,000 scanner, alerts, and AI summaries.
- Limited daily scanner
- Top 25 coins
- Basic bullish/bearish rating
- Limited watchlist
- Top 1,000 crypto scanner
- Breakout score ranking
- Advanced TA indicators
- Volume surge alerts
- AI-generated summaries
- Personal watchlists
- Daily email reports
- Everything in Pro
- Real-time alerts
- Advanced pattern detection
- Custom scanner filters
- Portfolio monitoring
- Priority data refresh
- Early access to new tools
Breakout Radar is not financial advice. Crypto trading involves significant risk. Technical analysis does not guarantee future performance. Always do your own research and never invest more than you can afford to lose.
Start Finding Bullish Crypto Setups in Minutes
Let Breakout Radar scan the crypto market for you and surface coins showing the strongest technical momentum, breakout potential, and bullish chart structure.